surface diffusion and related phenomena in the lab
Experimental observations of surface diffusion, bulk diffusion, and related capillarity-driven motion.
Surface diffusion in real life
A solid flowing along its own surface
In many physical systems, an evolving solid may change shape without losing volume. Atoms can migrate along its surface, driven by differences in curvature. A groove can deepen, a wire can bead up, and a narrow neck can break.
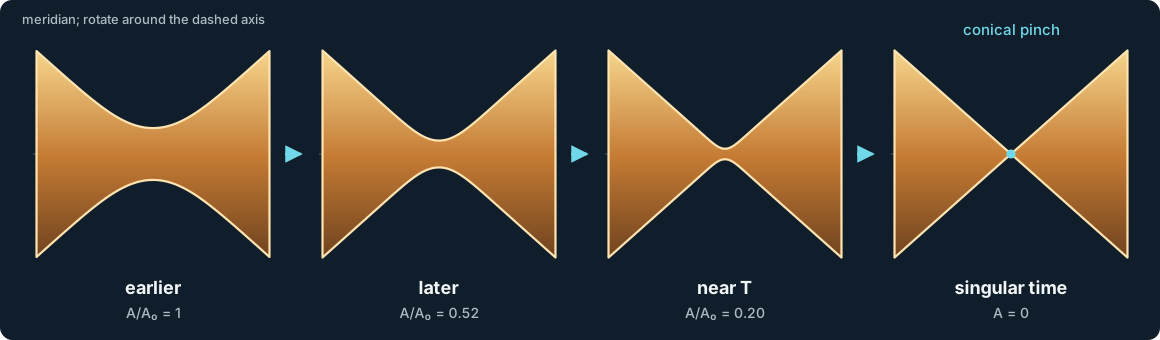
These experiments are the physical setting for Pinchoff by surface diffusion. They show the transport mechanism and its practical consequences. The theorem proves that the ideal geometric law itself can carry a smooth closed surface to a one-point conical singularity.
01
The practical question, from Mullins' point of view
Mullins began with a materials problem: how does a hot crystalline surface rearrange when atoms are mobile on the surface but the solid as a whole does not flow? Curvature changes the surface chemical potential; atoms diffuse along the surface; conservation of mass turns that flux into motion of the surface itself.
 Observed groove · Fig. 4
  Measured clock · Fig. 5
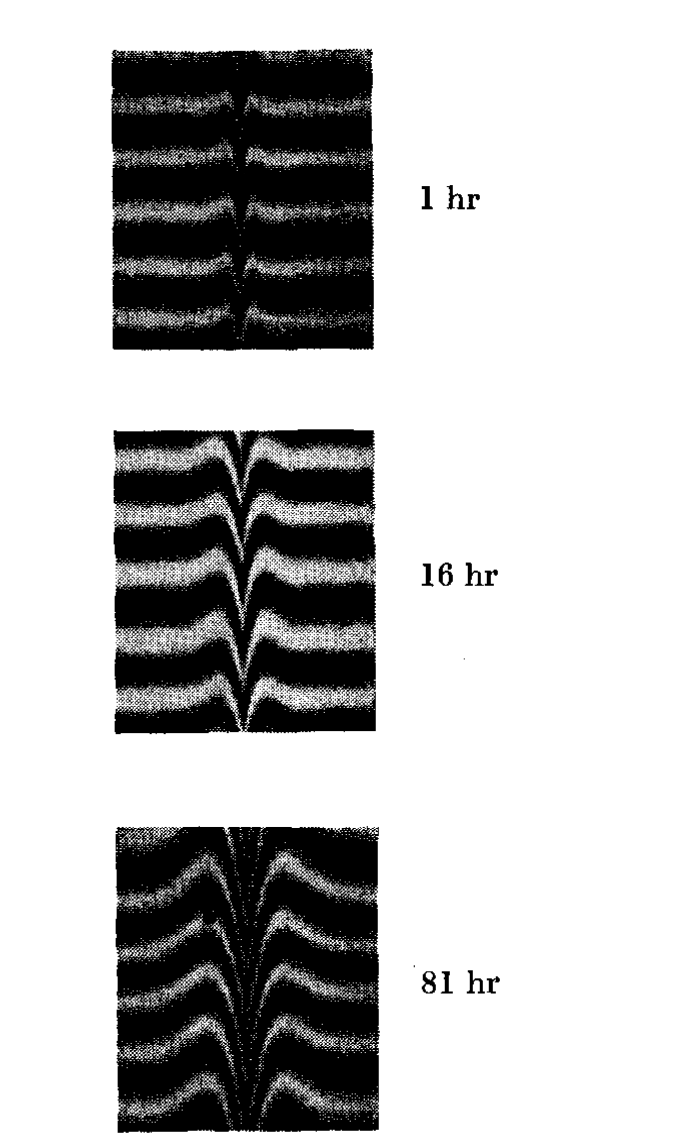
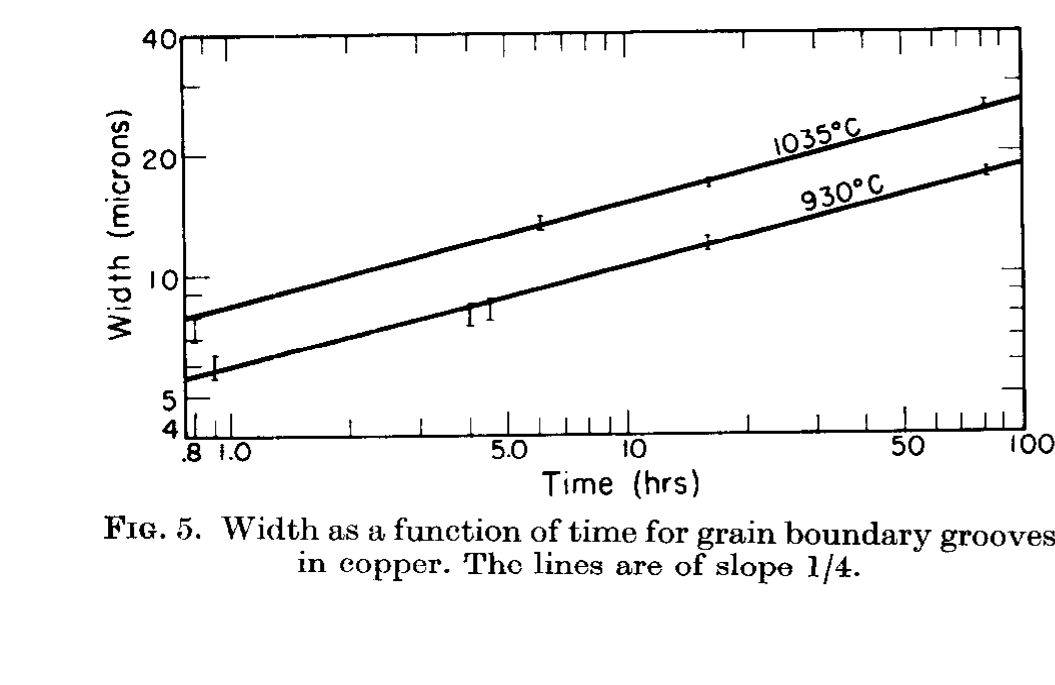
 Surface diffusion is a smoothing law, but it is not simply a law that makes every shape rounder. The same fourth-order transport that broadens a groove can amplify a long-wave disturbance on a thin cylinder until the cylinder loses connectivity.
Mullins and Shewmon, Acta Metallurgica02
Examples
Each example below is built around a published figure or an image supplied by a researcher. Experimental and simulated panels are identified in the caption.
Atoms diffuse
Surface steps walk across a crystalline solid
The atomic lattice remains visible while surface steps migrate along a 6.6 nm silver wire under tension. When two steps overlap, a partial dislocation nucleates. The image makes the microscopic carrier of surface diffusion visible rather than merely inferred.
Wang et al. (2021), Nature Communications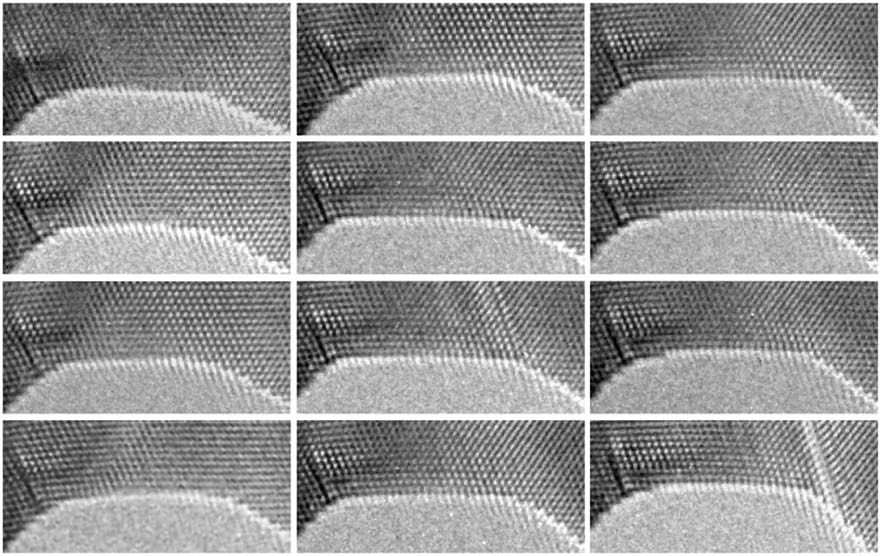
Why is this important? Because surface motion can change the mechanical strength of a nanoscale component even when the component remains solid.
Phase interfaces coarsen
A binary alloy separates isothermally and coarsens
At a fixed temperature, the fine silver-rich and copper-rich pattern reorganises. Thin regions disappear and the typical size of the remaining regions grows between 2 and 40 hours.
Böhme and Müller (2008), Computational Materials Science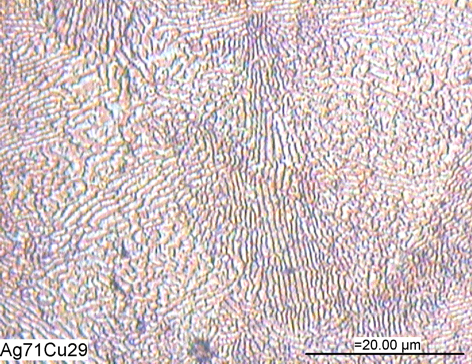 2 hours
 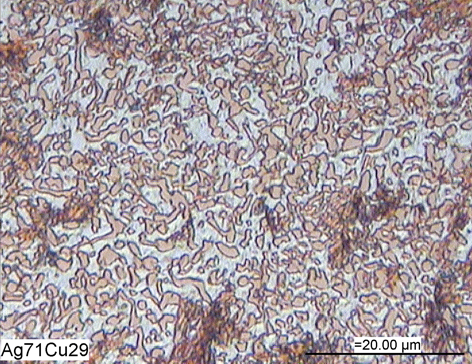 5 hours
 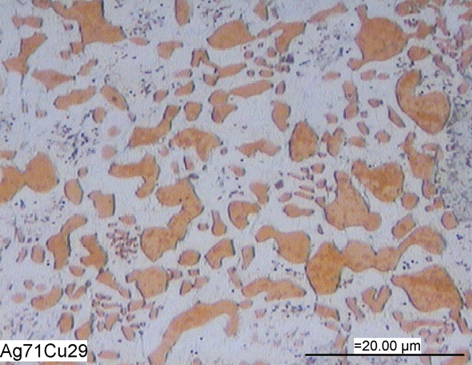 40 hours
 Why is this important? Because coarsening changes the strength and lifetime of solder joints. Here the measured $$t^{1/3}$$ growth points to bulk-diffusion-driven Ostwald ripening, not surface diffusion. With interface-localised mobility, however, the sharp-interface limit of the Cahn–Hilliard model is surface diffusion.
Watch a neck fail
A solid neck thins, separates, and rounds into particles
The lower row follows a gold wire in the TEM for nearly half an hour. The upper row is a three-dimensional atom-hopping calculation. Both show material leaving the constricted regions and accumulating in the thicker parts until the wire separates.
Schnedlitz et al. (2017), Physical Chemistry Chemical Physics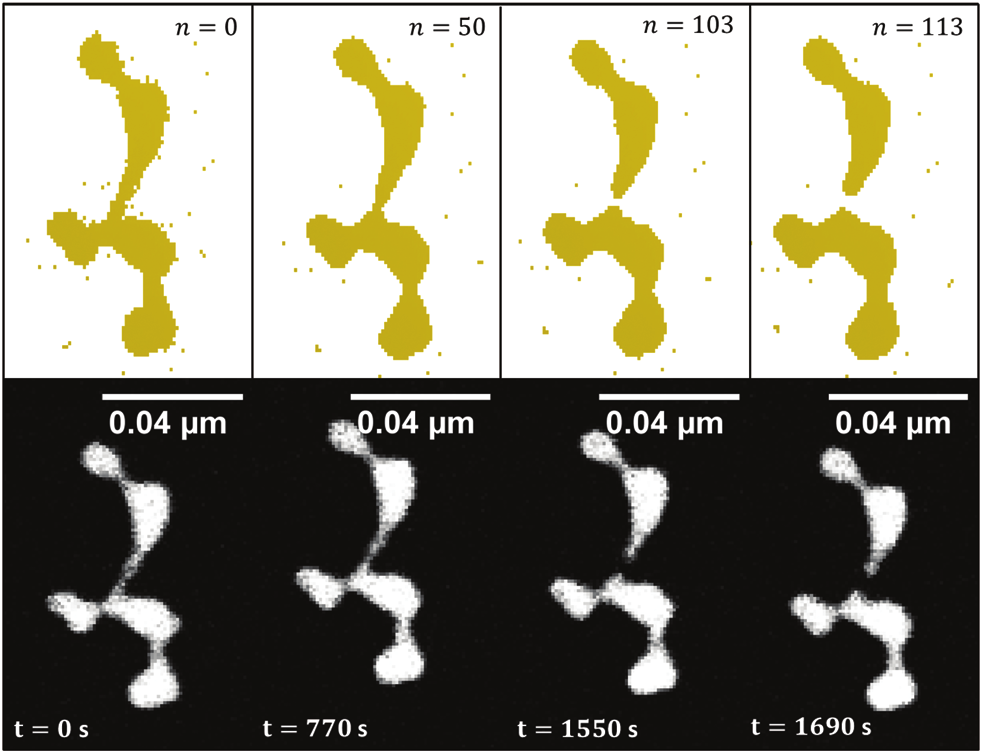
Why is this important? The experiment records the topology change, while the model tests whether thermally activated surface motion can reproduce its timing and location.
Bulk diffusion has its own universal pinchoff
Time-resolved synchrotron tomography follows a liquid rod through a 27.5-minute interval spanning separation. Copper is transported through the high-diffusivity liquid phase, rather than along the interface, yet the neck still approaches a conical pinch.
Aagesen et al. (2010), Nature Physics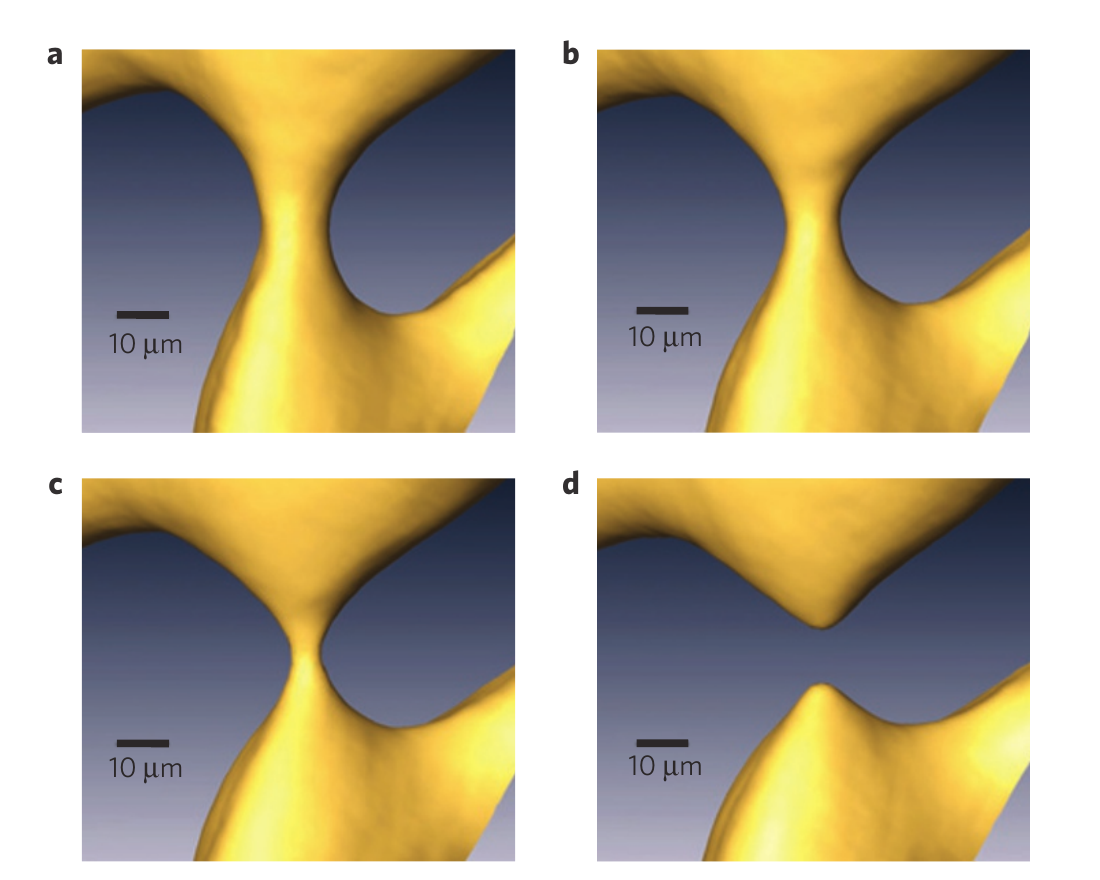
Why is this important? The same visible event can come from a different kinetic law. Here the similarity length scales as $$(T-t)^{1/3}$$, whereas for surface diffusion it scales as $$(T-t)^{1/4}$$. The shape alone does not identify the transport mechanism.
An X-ray experiment reveals the neck’s curvature
These are three-dimensional reconstructions of experimental measurements. A computer is used to reconstruct and display the measured interface; the sequence is not a simulated evolution of the diffusion equation. Peter supplied the original images, and the same sequence appears in PSI’s account of the experiment.
The experiment. Aagesen and colleagues studied an aluminium alloy containing 15% copper by mass, held at 565 °C. At this temperature the sample contains both solid and liquid: the object shown is a liquid rod within a solid, aluminium-rich matrix. They followed its changing shape using synchrotron X-ray tomographic microscopy at the TOMCAT beamline of the Swiss Light Source, Paul Scherrer Institut. X-ray projections taken as the sample rotates reconstruct its internal structure in three dimensions; repeated scans reveal how the neck thins and separates.
From scans to coloured surfaces. The study converted the tomograms into solid and liquid regions, smoothed reconstruction artefacts, and visualised individual pinching events in Amira. The displayed surface is the boundary between the phases. Its colours show local mean curvature: blue, violet and black indicate increasingly negative values on the supplied scale as the neck narrows. They describe the geometry, rather than the material’s visible colour or temperature.
The physical mechanism. Interfacial energy drives redistribution of copper by bulk diffusion through the liquid. The paper also computes theoretical similarity shapes using a boundary-integral method and compares them with the measured interfaces. Those numerical predictions are a separate part of the study; this viewer shows the experimental reconstructions.
Aagesen et al. (2010), Nature Physics — experiment and data-analysis methods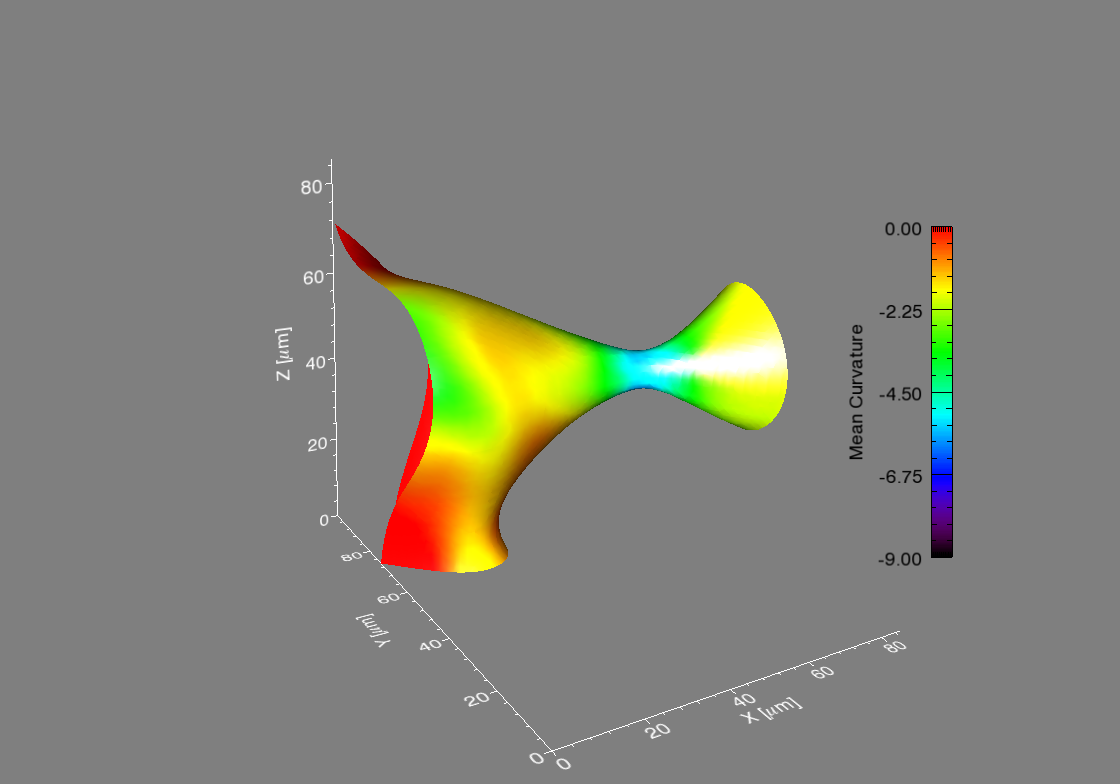
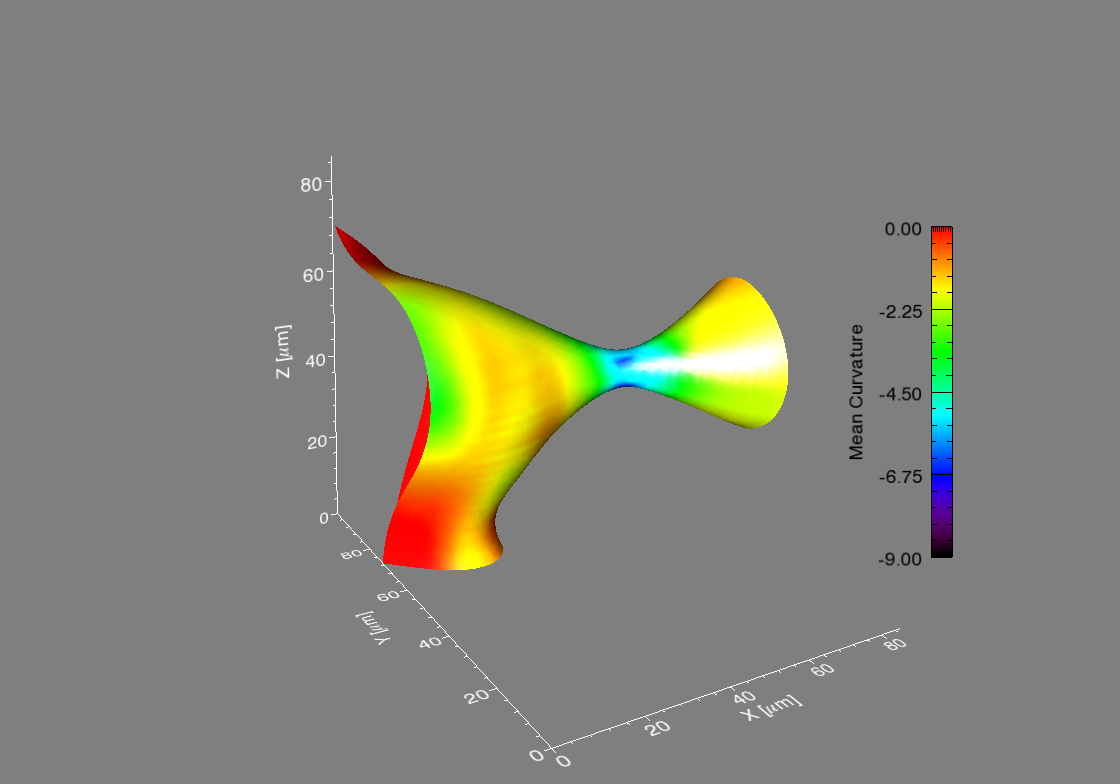
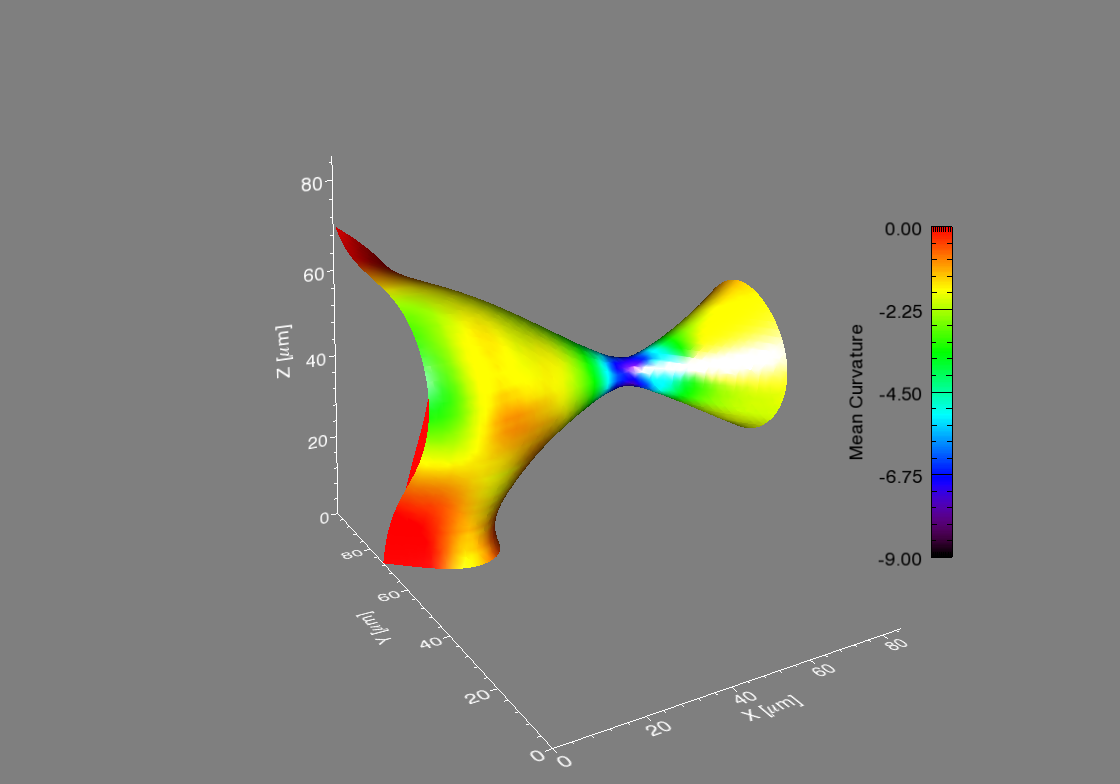
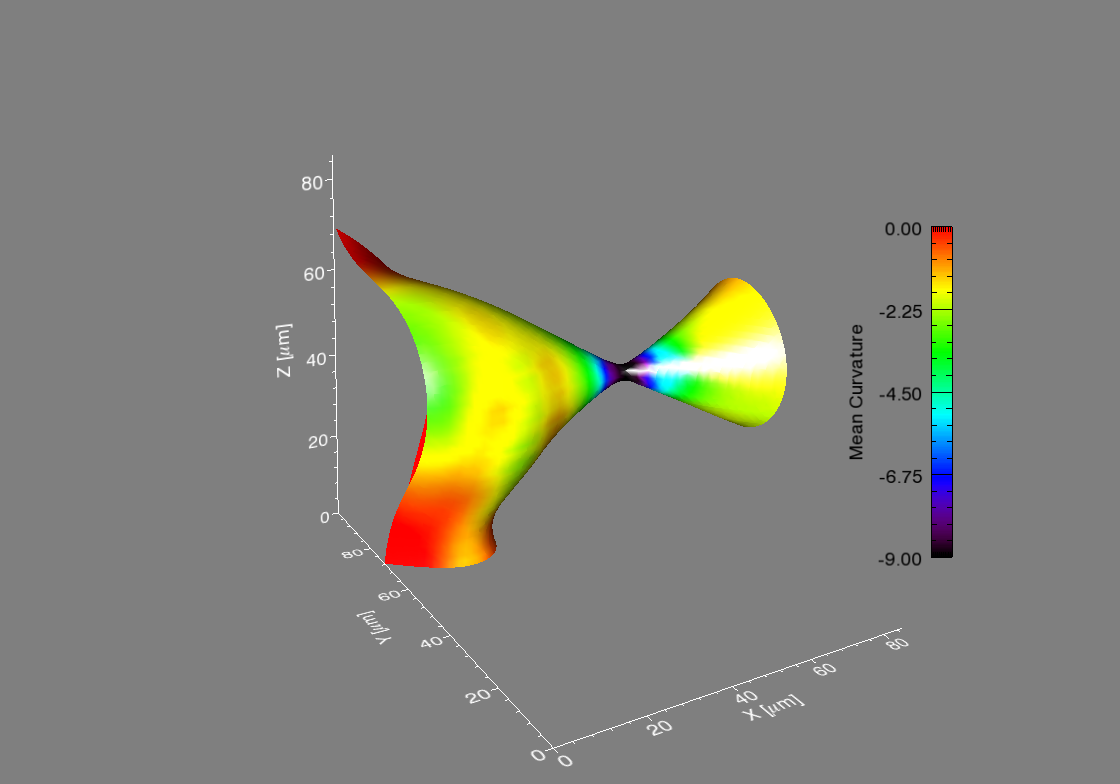
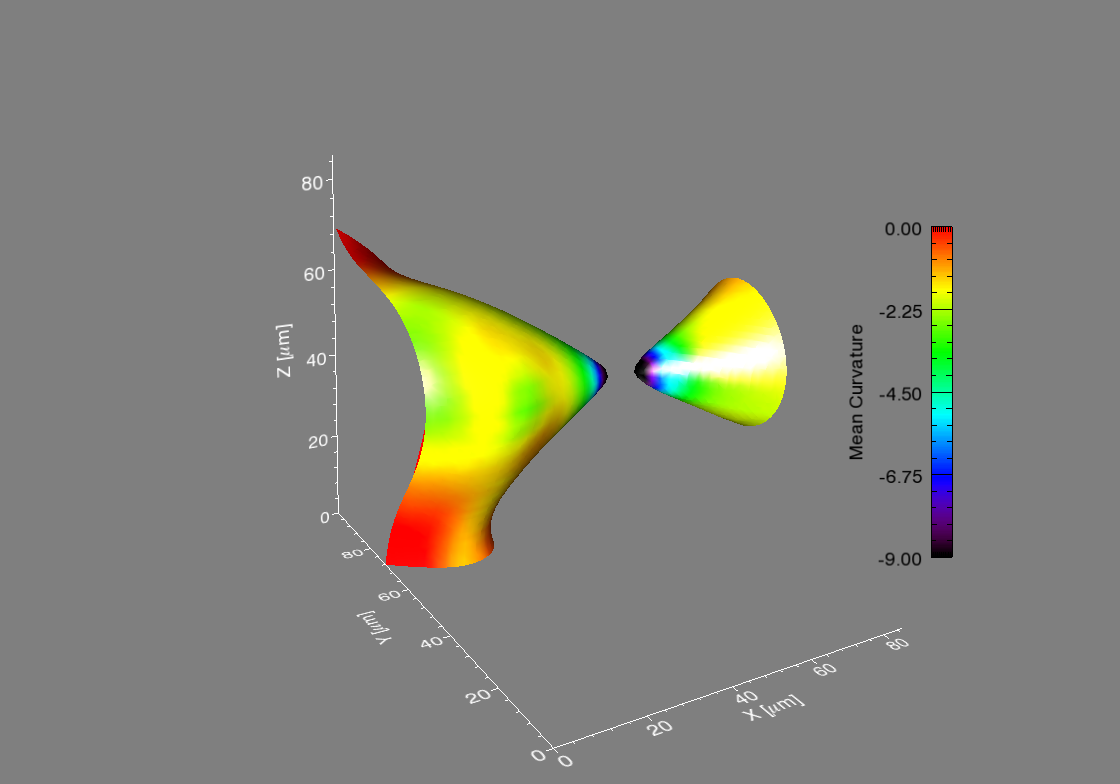
Stage 1 of 5 · Connected neck
Why is this important? Curvature helps set the interfacial chemical potential that drives redistribution of material. Identifying the transport law still requires evidence of where material moves and how the neck changes with time; a curvature map alone does not distinguish bulk diffusion from surface diffusion.
An engineering consequence
Memory survives until pinchoff, which needs precise prediction
Conductive filaments in resistive-memory devices were measured over lifetimes from microseconds to years. Thin-filament lifetime follows $$\tau\sim d^4,$$ the diameter law expected when surface diffusion controls the break.
Wang et al. (2019), Nature Communications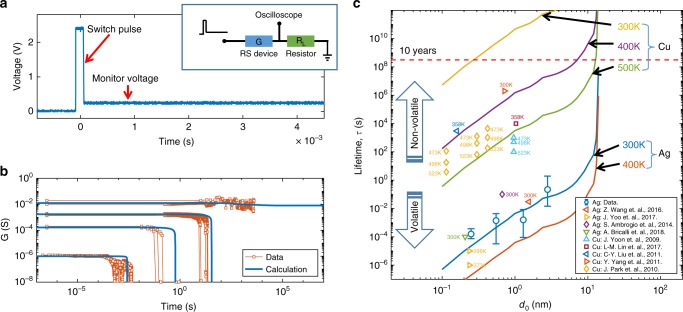
Why is this important? A small change in filament diameter can turn a fleeting electrical state into long-term data retention.
A conducting network fails wire by wire
After annealing, continuous silver wires become isolated rods and beads. Thicker wires survive to higher temperatures; thinner wires lose the connected paths that carry current.
Chung, Park and Lee (2020), Data in Brief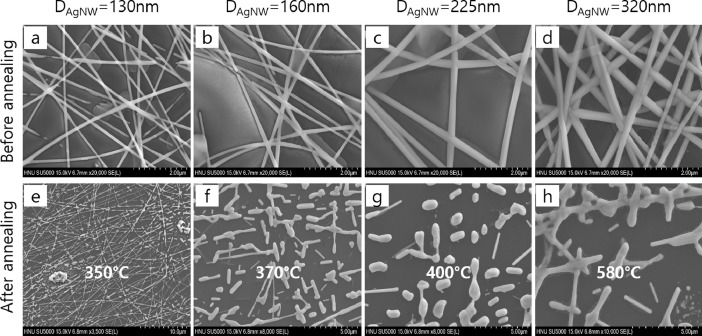
Why is this important? A local pinchoff becomes device failure when it breaks the last conducting route across a transparent electrode.
Crystal structure can be used to prevent breakup
Templated dewetting turns patterned silicon films into connected, sub-millimetre-long crystalline wires. Facet-dependent surface energies steer the evolution away from the bead-forming instability of an isotropic cylinder.
Bollani et al. (2019), Nature Communications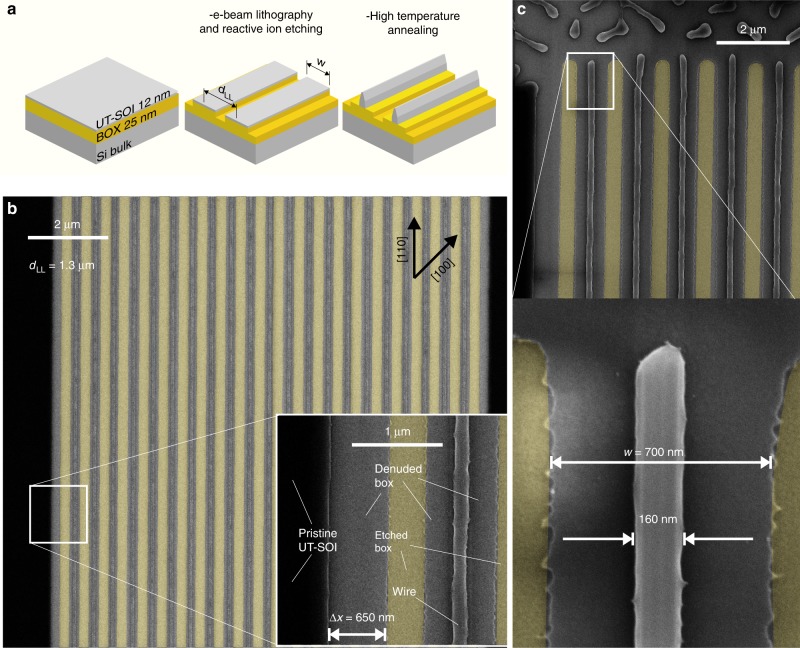
Why is this important? Understanding pinchoff also suggests how to suppress it: use crystalline anisotropy to preserve a long conducting path.
03
Which model does the cold silver wire follow?
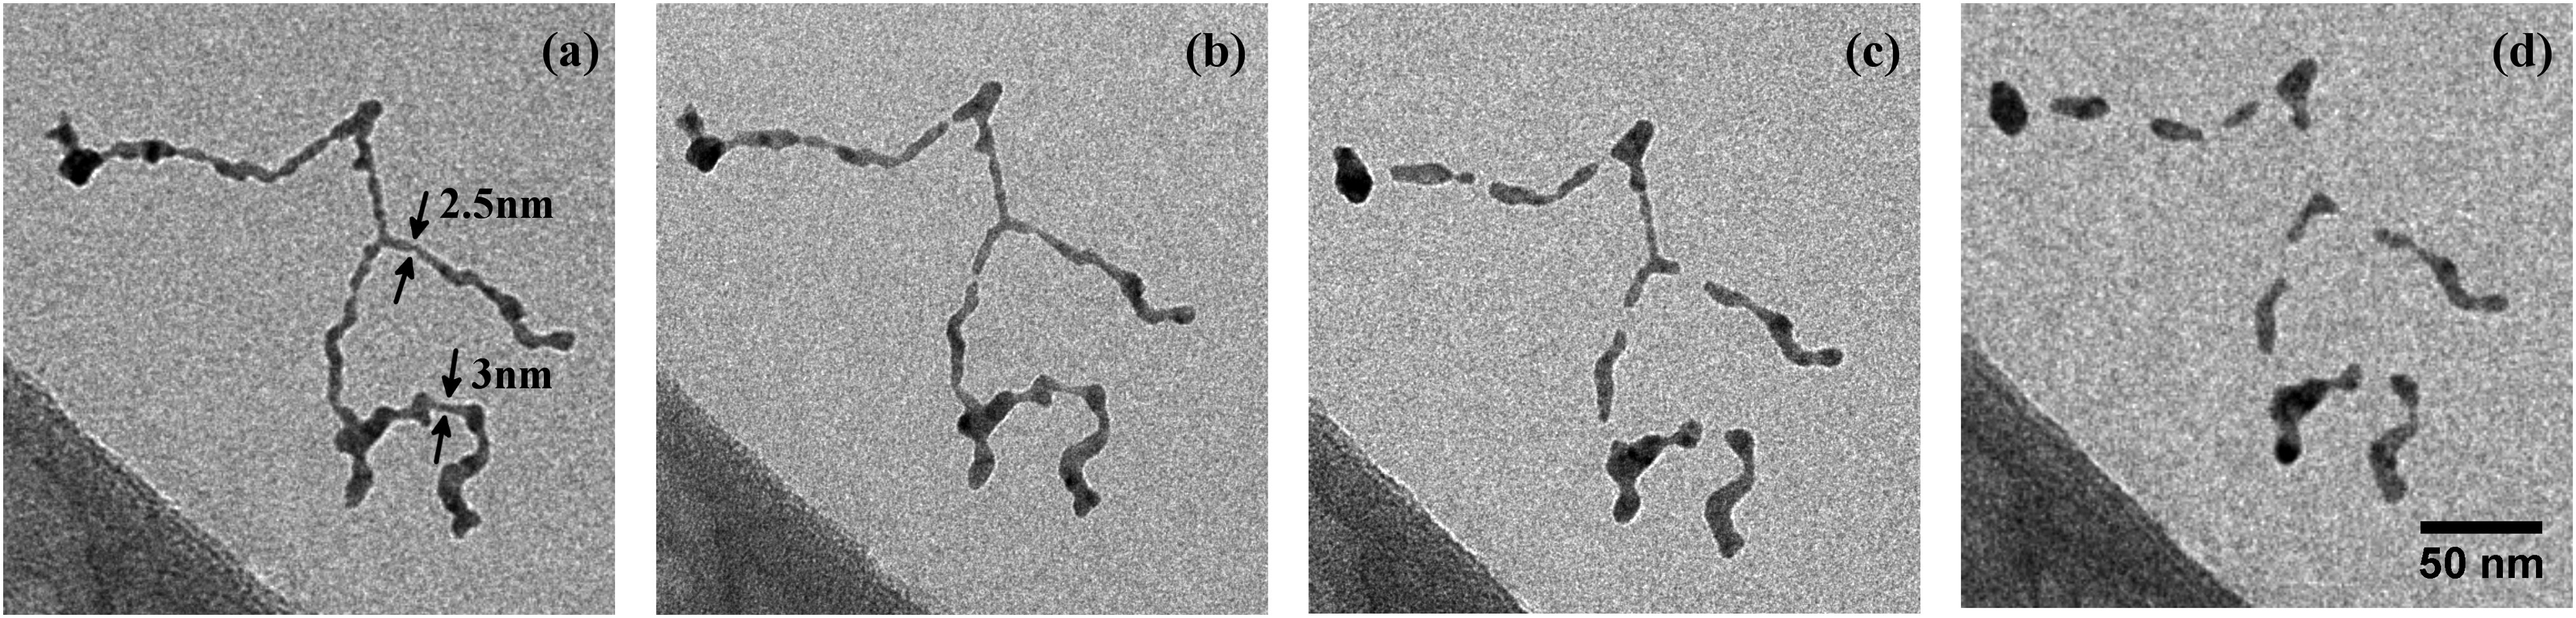
Experimental photographs
The model actually used
Volk and co-workers traced the TEM silhouette and evolved it as a two-dimensional, constant-thickness contour. They set $$B=1,$$ so the calculation predicts the order and location of breaks, not the physical breakup time.
The free three-dimensional surface
A round free cylinder is unstable when $$kR_0<1.$$ Its fastest wavelength is $$2\pi\sqrt2R_0=4.44D,$$ and the fastest growth rate scales like $$R_0^{-4}.$$ That fourth-power clock explains why a wire only a few nanometres across can change rapidly.
What the picture and model support
The wire is solid: it is unchanged at 253 K, begins smoothing and necking at 268 K, and is segmented by 293 K. The contour model reproduces several observed break locations, which is good evidence for curvature-driven surface flux.
It is not yet the theorem’s ideal three-dimensional experiment. TEM records a projection; the wire lies on a 3 nm amorphous-carbon film; crystalline anisotropy is suppressed in the calculation; and the diameter is only about twelve lattice spacings. The change near 260 K is a diameter- and protocol-dependent kinetic onset, not a phase transition.
Volk et al., Physical Chemistry Chemical Physics04
When is surface diffusion the right model?
Cahn and Taylor's 1994 overview gives a useful checklist: surface energy is the driving force; matter is transported along the interface rather than through the bulk or the surrounding medium; and the relevant mass is conserved.
They distinguish three scenarios. If attachment and detachment are fast, transport along the surface is the bottleneck and Mullins' fourth-order law applies. If surface transport is fast, attachment kinetics controls a different volume-preserving curvature law. If the rates are comparable, their full intermediate law is needed. The material, temperature, crystal orientation and length scale determine which scenario is seen.
Cahn and Taylor, Acta Metallurgica et Materialia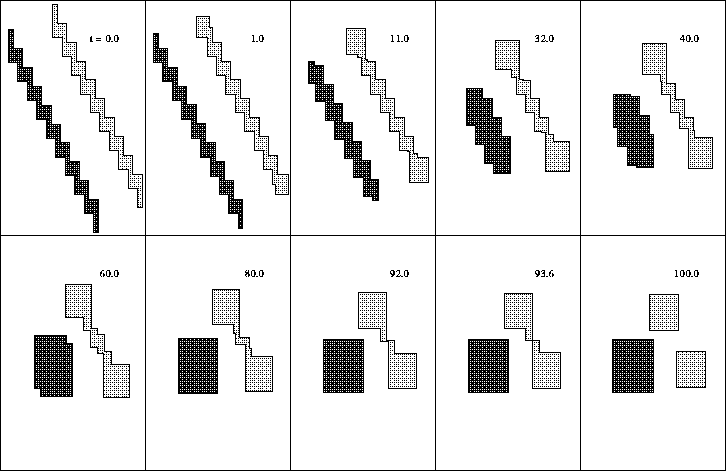
Sources and image credits
Every scientific image on this page is attached to the specific claim it supports and is identified by paper and figure number, or by its contributing researcher, in its caption. No image is AI-generated. The conical profile is regenerated numerically from the certified equation.
Figures from Wang et al. (2021), Schnedlitz et al. (2017), Wang et al. (2019), Bollani et al. (2019), and Chung, Park and Lee (2020) are used under the Creative Commons licences linked in their captions. Volk et al. (2015) is used under CC BY-NC 3.0. Mullins and Shewmon (1959), Figs. 4 and 5, are reproduced at reduced resolution for scholarly commentary; rights remain with the publisher.
The Ag–Cu micrographs from Böhme and Müller (2008), Fig. 5, and the kinetic comparison from Carter, Roosen, Cahn and Taylor (1995), Fig. 5, are reproduced at reduced resolution for scholarly commentary; rights remain with the publishers.
The liquid-rod time sequence from Aagesen et al. (2010), Fig. 1, is reproduced with the permission of Peter W. Voorhees; rights remain with Macmillan Publishers Limited. The five additional mean-curvature images are credited to A. E. Johnson and P. W. Voorhees, Northwestern University, in PSI’s 2010 account of the experiment. Peter W. Voorhees supplied the originals, reproduced here with permission and with their original axes and colour scales intact.